How to Calculate the Average: Formulas for Mean, Median, Mode, and Weighted Average
Learn how to calculate the average using arithmetic mean, median for odd and even sets, mode frequency, and weighted averages. Master formulas, worked examples, and common pitfalls.

Whether you are calculating a course grade, evaluating home prices across different neighborhoods, budgeting your monthly utility bills, or analyzing scientific test samples, finding the "average" is the most fundamental statistical calculation in everyday life. Yet when someone asks you to find an average, what mathematical measure do they actually mean?
In colloquial conversation, people almost always use the word average to refer to the arithmetic mean—the sum of all numbers divided by the total number of items. In mathematics, statistics, and data science, however, the term "average" encompasses several distinct measures of central tendency. The four primary averaging methods are:
- Arithmetic Mean (x̄): The traditional mathematical average computed by adding every value and dividing by the observation count.
- Median (x̃): The physical midpoint value separating the top 50% from the bottom 50% in a sorted dataset.
- Mode (x̂): The specific number or category that appears most frequently in a dataset.
- Weighted Average (x̄w): An average where each data point contributes proportionally according to its assigned credit, probability, or percentage weight.
Using the wrong averaging formula can lead to catastrophic distortions. For instance, calculating average salaries with the arithmetic mean in a company with one billionaire executive will make ordinary employees appear wealthy. Conversely, calculating an academic syllabus grade as a simple mean rather than a weighted average will give a 5-minute quiz the exact same impact as a 3-hour final exam.
If you need an instantaneous, privacy-safe computation, you can paste your raw numbers into the free CoditTools Average Calculator. In this comprehensive guide, we examine the mathematical formulas, step-by-step arithmetic, practical edge cases, and real-world applications for all four averaging methods.

The Arithmetic Mean: Definition, Formula & Step-by-Step Calculation
The arithmetic mean (commonly referred to simply as the "mean" or "average") is the balance point of a numeric dataset. If every value in your dataset were pooled together and redistributed equally among all observations, each observation would receive exactly the arithmetic mean.
The Arithmetic Mean Formula
Mean (x̄) = (x₁ + x₂ + x₃ + … + xₙ) ÷ n = (∑ x) ÷ n
x̄(pronounced "x-bar"): Sample arithmetic mean.∑ x(Sigma x): The total sum of all individual data values.n: The total count of observed values in the dataset.
- Every single data value influences the final result.
- The sum of deviations from the mean always equals zero:
∑(x - x̄) = 0. - Highly vulnerable to extreme high or low outliers.
Step-by-Step Arithmetic Mean Example
Suppose you are auditing weekly study hours recorded by five university students: 14, 18, 22, 22, and 34 hours. How can I calculate the average study time?
- Step 1: Calculate the Total Sum (∑ x):
14 + 18 + 22 + 22 + 34 = 110 hours - Step 2: Count the Number of Observations (n):
There are 5 student entries, son = 5. - Step 3: Divide the Sum by the Count:
Mean = 110 ÷ 5 = 22.00 hours per student
In this example, the arithmetic mean is exactly 22.00 hours. Because the dataset has no extreme outliers, the mean provides an intuitive, reliable representation of the cohort's overall effort.
How to Calculate the Median: Odd vs. Even Counts
The median (often denoted as x̃ or M) is the numerical value that sits directly at the physical center of an ordered list of numbers. Exactly 50% of the numbers in the dataset are smaller than or equal to the median, and exactly 50% are greater than or equal to the median.
The Non-Negotiable Rule of the Median
You can never calculate the median from raw, unsorted data. You must always sort all observations from smallest to largest (ascending order) before attempting to identify the midpoint.

Case 1: Median for an Odd Number of Values (n is Odd)
When a dataset contains an odd number of items, there is a single, unambiguous number sitting in the exact middle.
Position Formula: Median Position = (n + 1) ÷ 2
Taking our previous student study hours dataset: [34, 14, 22, 18, 22]:
- Sort the values in ascending order:
[14, 18, 22, 22, 34]. - Calculate the midpoint index:
(5 + 1) ÷ 2 = 6 ÷ 2 = 3rd item. - Locate the 3rd item in the sorted array: 22.00.
- Verify: There are exactly two items below 22 (14 and 18) and two items above 22 (22 and 34). The median is 22.00.
Case 2: Median for an Even Number of Values (n is Even)
When a dataset has an even number of observations, there is no single middle element. Instead, two numbers share the center. The median is calculated as the arithmetic average of those two middle numbers.
Position Formula: The two middle indices are n ÷ 2 and (n ÷ 2) + 1.
Suppose a sixth student is added to the study group with 46 hours: [14, 18, 22, 22, 34, 46] (n = 6):
- Confirm sorted order:
[14, 18, 22, 22, 34, 46]. - Identify middle positions:
6 ÷ 2 = 3rd item (22)and(6 ÷ 2) + 1 = 4th item (22). - Average the two middle numbers:
(22 + 22) ÷ 2 = 22.00.
Now consider a dataset where the two middle values differ: [12, 16, 20, 26, 32, 44] (n = 6):
- The 3rd item is 20 and the 4th item is 26.
Median = (20 + 26) ÷ 2 = 46 ÷ 2 = 23.00.
Notice an interesting mathematical property: the median (23.00) is a valid, accurate descriptor of central tendency even though the number 23 does not appear anywhere in the original raw dataset.
How to Identify the Mode: Unimodal, Bimodal & Multimodal Data
The mode (denoted as x̂) is the value that appears with the highest frequency in a dataset. Unlike the mean and median, which can only be computed for quantitative numerical data, the mode can be applied to both numeric values and qualitative categorical data (such as voting preferences, car colors, or blood types).
Types of Modal Distributions
| Distribution Type | Dataset Example | Mode Result | Practical Explanation |
|---|---|---|---|
| Unimodal (Single Mode) | [14, 18, 22, 22, 34] | 22 (Frequency = 2) | One clear peak; 22 occurs twice while all other numbers occur once. |
| Bimodal (Two Modes) | [4, 7, 7, 9, 12, 12, 15] | 7 and 12 (Tie = 2) | Two separate values share the highest frequency. Commonly seen in morning/evening commute traffic. |
| Multimodal (3+ Modes) | [2, 2, 5, 5, 8, 8, 11] | 2, 5, and 8 (Tie = 2) | Three or more distinct peaks across the distribution. |
| No Mode (Uniform) | [10, 15, 20, 25, 30] | No Mode | Every number appears exactly once. It is mathematically incorrect to say the mode is "0". |
When Is the Mode Most Useful?
The mode is indispensable in supply chain logistics, retail inventory planning, and production manufacturing:
- Footwear and Apparel: A shoe manufacturer does not care that the arithmetic mean shoe size of male customers is 9.73. You cannot manufacture a 9.73 shoe. The manufacturer needs to know the modal shoe size (e.g., Size 10) to stock inventory efficiently.
- Public Transportation: City planners schedule buses around the modal commute hours (e.g., 7:30 a.m. to 8:30 a.m.), not the mean hour of the day (noon).
- Survey Audits: Identifying the most popular customer rating (e.g., "5 Stars") on an e-commerce platform.
How to Calculate a Weighted Average
In standard arithmetic averaging, every single observation is treated as possessing identical importance. However, in academic grading, financial investment portfolios, and composite consumer price indices, certain components carry far more significance than others.
A weighted average (weighted mean, denoted as x̄w) assigns a proportional coefficient (weight, w) to each value before summing.
The Weighted Average Formula
Weighted Mean (x̄w) = [ ∑ (wᵢ × xᵢ) ] ÷ [ ∑ wᵢ ]
xᵢ: The raw score, price, or data value.wᵢ: The corresponding weight (percentage, credit hours, or frequency).∑(wᵢ × xᵢ): Sum of individual weighted products.∑ wᵢ: Sum of all weights.
When weights are expressed as decimals summing to 1.00 (or percentages summing to 100), the denominator is 1, simplifying the calculation to:
x̄w = ∑(Weight Decimal × Score)

Step-by-Step Worked Weighted Grade Example
Consider a college syllabus with four weighted assessment categories:
- Homework & Assignments: Weight = 20% (0.20), Student Score = 92.0%.
- In-Class Quizzes: Weight = 15% (0.15), Student Score = 80.0%.
- Midterm Examination: Weight = 25% (0.25), Student Score = 76.0%.
- Comprehensive Final Exam: Weight = 40% (0.40), Student Score = 85.0%.
To calculate the student's final composite grade:
| Assessment | Raw Score (xᵢ) | Weight (wᵢ) | Multiplication (wᵢ × xᵢ) | Earned Course Points |
|---|---|---|---|---|
| Homework & Problem Sets | 92.0% | 20% (0.20) | 92 × 0.20 | 18.40 pts |
| In-Class Quizzes | 80.0% | 15% (0.15) | 80 × 0.15 | 12.00 pts |
| Midterm Exam | 76.0% | 25% (0.25) | 76 × 0.25 | 19.00 pts |
| Comprehensive Final Exam | 85.0% | 40% (0.40) | 85 × 0.40 | 34.00 pts |
| Total Course Outcome | — | ∑w = 100% | Sum of Products | 83.40% (Grade B) |
Why Simple Averaging Fails Here
What would happen if the student calculated their grade as an unweighted simple average?
Naive Simple Average = (92 + 80 + 76 + 85) ÷ 4 = 333 ÷ 4 = 83.25%
The naive average produces 83.25%, whereas the true weighted average is 83.40% (+0.15% higher). The weighted grade is higher because the student excelled on the final exam (85%), which carried 40% of the entire course grade—double the weight of the homework and nearly triple the weight of quizzes. For dedicated academic modeling, you can explore our CoditTools Grade Calculator and read our deep dive on weighted vs. unweighted GPA.
Outlier Sensitivity: When the Mean Distorts Reality
The single greatest weakness of the arithmetic mean is its sensitivity to extreme outliers. Because every numeric value is added to the numerator, a single unusually large or small value exerts disproportionate mathematical leverage on the outcome.
The Famous "Coffee Shop" Thought Experiment
Consider five baristas working in a local coffee shop with the following annual salaries:
- Arithmetic Mean:
($32,000 + $34,000 + $35,000 + $36,000 + $38,000) ÷ 5 = $175,000 ÷ 5 = $35,000. - Median: The 3rd value is exactly
$35,000.
In this balanced dataset, the mean and median are completely identical ($35,000). Both accurately reflect the economic reality of the workers.
Now, suppose a tech executive earning $850,000 per year walks into the shop to order an espresso. If we recalculate the metrics for the six people present:
- New Arithmetic Mean:
($175,000 + $850,000) ÷ 6 = $1,025,000 ÷ 6 = $170,833.33 - New Median:
Average of 3rd and 4th middle salaries:($35,000 + $36,000) ÷ 2 = $35,500.00
Look at what happened: the arithmetic mean skyrocketed from $35,000 to over $170,800—a staggering 388% increase! If a journalist reported that the "average person in the room earns $170,800," that statement would be mathematically true in terms of the arithmetic mean, but wildly misleading in terms of real-world reality: five of the six people earn less than a quarter of that figure.
Meanwhile, the median moved from $35,000 to $35,500 (+1.4%). This illustrates why economists, housing bureaus, and national statistical agencies universally report median household income and median home sale prices rather than mean values.
The "Average of Percentages" Trap
One of the most dangerous and widespread mathematical mistakes in business reporting, education, and sales analytics is averaging a list of percentages directly.
The Cardinal Rule of Percentage Averages:
You can never calculate the simple arithmetic mean of percentages unless the sample sizes (denominators) of every percentage are exactly identical.
Worked Proof of the Percentage Trap
Imagine a school principal comparing pass rates between two mathematics classrooms:
- Classroom A (Advanced Seminar): 20 students enrolled. 18 passed. Pass rate = 90.0% (18 ÷ 20).
- Classroom B (Large Lecture): 100 students enrolled. 60 passed. Pass rate = 60.0% (60 ÷ 100).
If an administrator makes the naive mistake of averaging the two percentages:
Naive Calculation: (90% + 60%) ÷ 2 = 75.0% (INCORRECT)
Now calculate the true institutional pass rate across all students:
- Total students passed:
18 + 60 = 78 students. - Total students enrolled:
20 + 100 = 120 students. True Overall Pass Rate = 78 ÷ 120 = 0.65 = 65.0%.
The naive calculation overestimated the pass rate by 10.0 full percentage points! Classroom B had five times as many students as Classroom A; therefore, its 60% result must carry five times the statistical weight. To calculate percentages correctly across uneven pools, check our companion CoditTools Percentage Calculator.
Step-by-Step Guide: Using the CoditTools Average Calculator
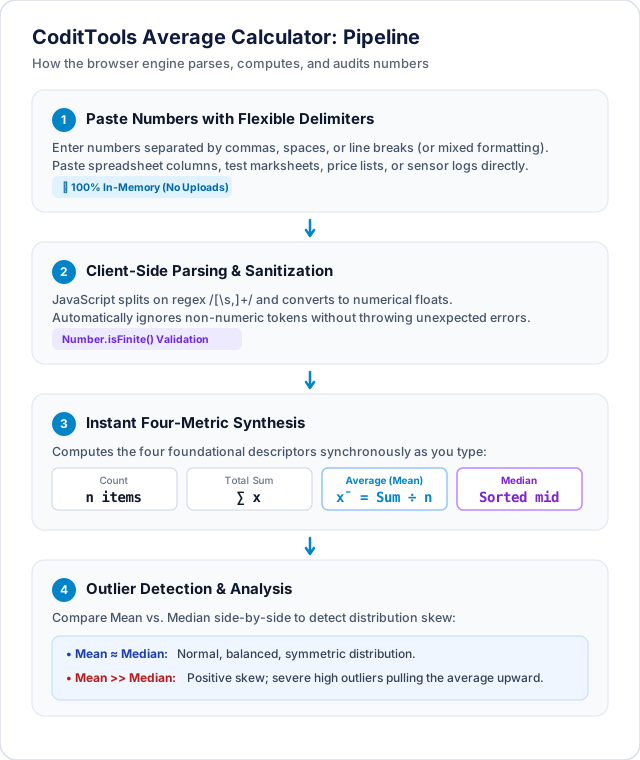
The CoditTools Average Calculator allows you to evaluate datasets in seconds without spreadsheet software, complex formulas, or cloud data uploads. The utility runs 100% client-side inside your browser.
-
Paste or Type Your Number List:
Copy numbers from Excel, Google Sheets, a text document, or an email. You can separate values using commas (
12, 15, 18), whitespace (12 15 18), or vertical line breaks. Mixed delimiters are automatically supported. -
In-Memory Sanitization & Tokenization:
The browser engine applies the regular expression
/[s,]+/to split input strings, casts valid tokens to floating-point numbers, and validates them viaNumber.isFinite(). Any accidental text, currency symbols, or trailing commas are safely ignored rather than throwing syntax errors. -
Read Instant Diagnostic Metrics:
Four key statistical cards update synchronously above the textarea:
- Count: Total quantity of valid numeric entries processed.
- Average (Mean): Standard arithmetic mean rounded to two decimal places.
- Median: The exact midpoint of the numerically sorted array (handling even/odd counts automatically).
- Sum: The total cumulative sum of all numbers.
-
Perform Instant Outlier Auditing:
Compare the Average card against the Median card. If the Average is substantially higher than the Median, high-value outliers are skewing your distribution. If they are nearly equal, your data follows a balanced, symmetrical pattern.
Calculate Mean, Median & Total Sum in Seconds
Paste raw numeric lists, student marks, or supplier prices with flexible commas, spaces, or line breaks. 100% private in-browser execution with zero tracking.
6 Common Mistakes in Calculating Averages
When computing averages for business reports, academic grades, or laboratory experiments, six common mistakes frequently corrupt results:
-
Forgetting to Sort Before Finding the Median:
Picking the physical middle number of an unsorted list produces meaningless random results. Always arrange data in ascending numerical order first.
-
Confusing "No Mode" with a Mode of Zero:
If every value in a dataset is unique (e.g.
[10, 20, 30]), the correct statistical answer is that no mode exists. Claiming the mode is0is completely wrong, because 0 is a specific numeric value that was never observed. -
Averaging Averages with Unequal Group Sizes:
Just like averaging percentages, you cannot average group means directly if the groups contain different numbers of people or observations. You must calculate a weighted average based on sample size.
-
Ignoring Severe Outlier Distortion in Small Datasets:
Relying solely on the arithmetic mean when evaluating housing costs, salaries, or customer lifetime value. Always check the median alongside the mean to detect distribution skew.
-
Treating Weighted Tasks as Equal-Credit Components:
Averaging syllabus grades or university credit hours with simple addition. A 4-credit course affects your cumulative CGPA four times as much as a 1-credit lab. Use the CoditTools CGPA Calculator for multi-course academic records.
-
Dividing by (n − 1) for Arithmetic Mean:
Some students confuse the formula for the sample mean with the formula for sample variance or standard deviation, where
n - 1is used (Bessel's correction). The arithmetic mean always divides by n.
Frequently Asked Questions
What is the difference between average and mean?
In everyday language, "average" almost always refers to the arithmetic mean. In mathematical statistics, however, "average" is an umbrella term encompassing all measures of central tendency, including the arithmetic mean, median, mode, and weighted mean. Every arithmetic mean is an average, but not every average is an arithmetic mean.
How can I calculate the average of negative numbers?
The formula for the arithmetic mean remains identical when working with negative numbers: sum all values using standard algebraic signed addition and divide by the total count. For example, to average [-15, -5, 0, 10, 20] (n = 5): the sum is (-15) + (-5) + 0 + 10 + 20 = 10. Dividing by 5 yields an average of 10 ÷ 5 = 2.00.
When should I report the median instead of the mean?
You should report the median whenever your data distribution is skewed or contains extreme high or low outliers that would distort the arithmetic mean. Common examples include household income, home sale prices, net worth, web server response times (p50 latency), and recovery times in clinical trials.
Can a dataset have more than one mode?
Yes. If two distinct values tie for the highest frequency, the dataset is bimodal. If three or more values tie, it is multimodal. If every number in the dataset appears with the exact same frequency (e.g. each value appears once), the dataset has no mode.
How do I calculate a weighted average in Microsoft Excel or Google Sheets?
In Excel or Google Sheets, use the SUMPRODUCT function combined with SUM. If your raw scores are in cells A2:A5 and your percentage weights are in cells B2:B5, enter the formula: =SUMPRODUCT(A2:A5, B2:B5) / SUM(B2:B5). If your weights already sum to 100% or 1.0, =SUMPRODUCT(A2:A5, B2:B5) gives the final result directly.
Why does the CoditTools Average Calculator display both mean and median?
Presenting the mean and median side-by-side provides an instant visual health check on your data distribution. When the mean and median are close in value, your dataset is symmetric and balanced. When the mean diverges sharply from the median, you immediately know that extreme outliers are skewing your numbers.
Does CoditTools store or upload my pasted numeric data?
No. The CoditTools Average Calculator executes entirely inside your client browser memory using native JavaScript functions. No numbers, marks, prices, or datasets are ever transmitted across the network, stored on servers, or saved in cookies.
Conclusion & Practical Resources
Understanding how to calculate averages correctly transforms raw numbers into meaningful, actionable insights. Whether you need the equal-weight balance of the arithmetic mean, the outlier-resistant stability of the median, the categorical frequency of the mode, or the proportional precision of a weighted average, choosing the right formula ensures your analysis accurately reflects reality.
Whenever you need to summarize numbers instantly, verify marks, or audit data lists without spreadsheet setup, bookmark the CoditTools Average Calculator. To explore complementary calculation tools for academic records, business budgeting, and percentages, visit our Grade Calculator, CGPA Calculator, and our full suite of Math Tools.
Try the tools mentioned in this post - all free, no account needed.
Runs in your browser. No watermarks. No file uploads to a server.
Browse math calculators →